Edit chart
Loading graph
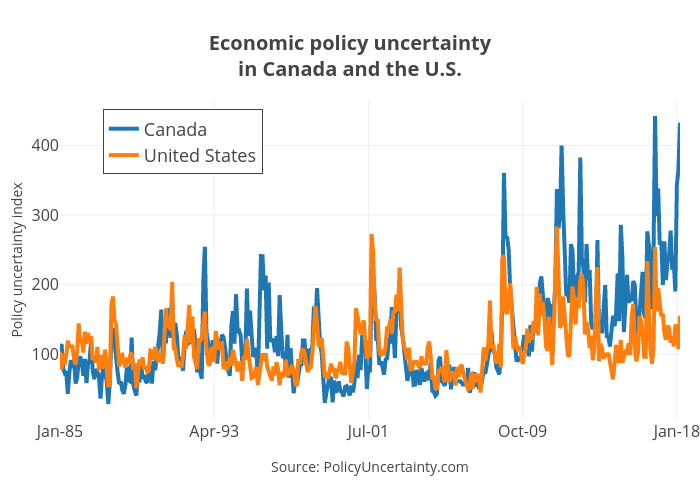
Jasonkirby's interactive graph and data of "Economic policy uncertaintyin Canada and the U.S." is a line chart, showing Canada vs United States; with Source: PolicyUncertainty.com in the x-axis and Policy uncertainty index in the y-axis.. The x-axis shows values from 0 to 398. The y-axis shows values from 5.546046049999994 to 465.36223905.