Edit chart
Loading graph
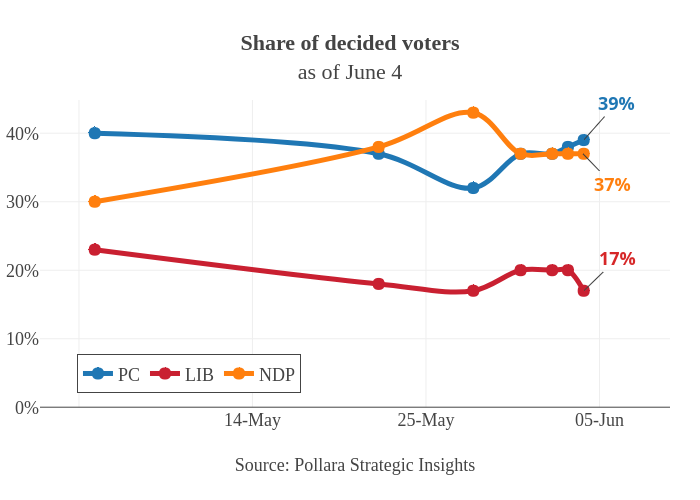
Jasonkirby's interactive graph and data of "Share of decided votersas of June 4" is a line chart, showing PC, LIB, NDP; with Source: Pollara Strategic Insights in the x-axis. The x-axis shows values from -2.20635775862069 to 37.20635775862069. The y-axis shows values from 0 to 44.85244271704253. This visualization has the following annotations: 37%; 39%; 17%