Edit chart
Loading graph
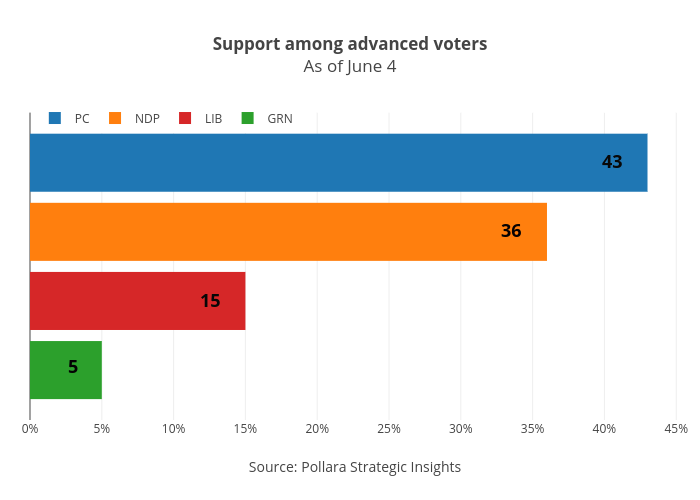
Jasonkirby's interactive graph and data of "Support among advanced votersAs of June 4" is a grouped bar chart, showing GRN, LIB, NDP, PC; with Source: Pollara Strategic Insights in the x-axis and in the y-axis.. The x-axis shows values from 0 to 45.26315789473684. The y-axis shows values from -0.5 to 0.5. This visualization has the following annotations: 43; 36; 15; 5