Edit chart
Loading graph
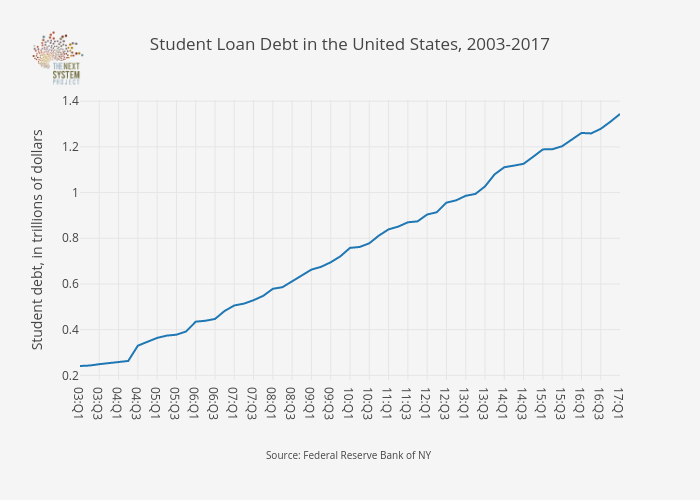
Jduda's interactive graph and data of "Student Loan Debt in the United States, 2003-2017" is a line chart, showing B; with in the x-axis and Student debt, in trillions of dollars in the y-axis.. The x-axis shows values from 0 to 56. The y-axis shows values from 0.1797222222222222 to 1.4052777777777778. This visualization has the following annotation: Source: Federal Reserve Bank of NY