Edit chart
Loading graph
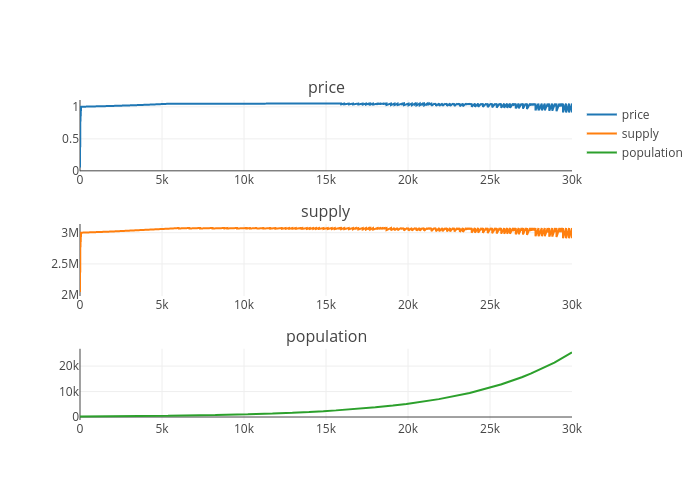
Jg2950's interactive graph and data of "price, supply, population" is a line chart, showing price, supply, population. The x-axis shows values from 0 to 29998. The y-axis shows values from -0.004528151499999994 to 1.1057341785. This visualization has the following annotations: price; supply; population