Edit chart
Loading graph
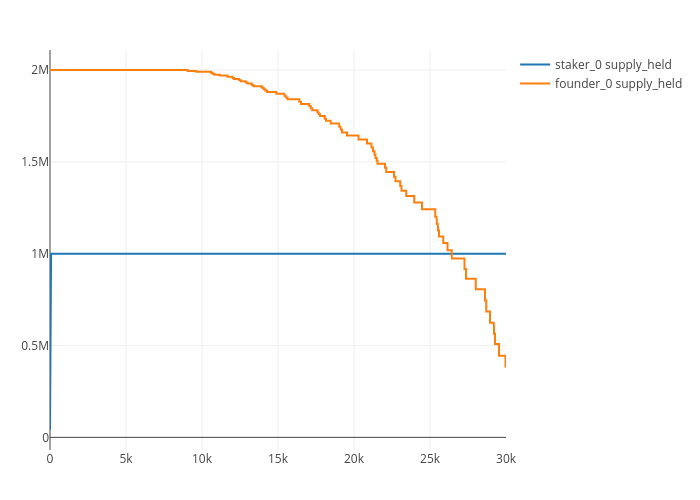
Jg2950's interactive graph and data of "Supply held by agent type" is a line chart, showing staker_0 supply_held vs founder_0 supply_held. The x-axis shows values from 0 to 29998. The y-axis shows values from -68888.88888888886 to 2108888.888888889.