Edit chart
Loading graph
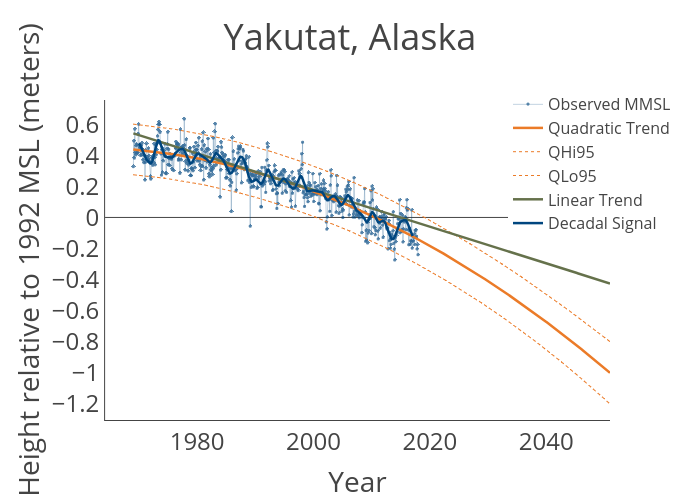
Johnboon's interactive graph and data of "Yakutat, Alaska" is a line chart, showing Observed MMSL, Quadratic Trend, QHi95, QLo95, Linear Trend, Decadal Signal; with Year in the x-axis and Height relative to 1992 MSL (meters) in the y-axis.. The x-axis shows values from 1964-07-08 03:38:21.172 to 2050-12-16. The y-axis shows values from -1.3018340809817537 to 0.7446694386533198.