Edit chart
Loading graph
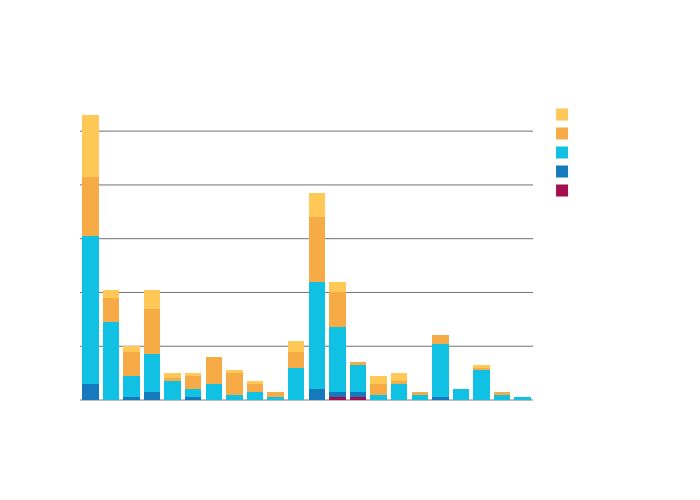
Jwitherstx's interactive graph and data of "{'font': {'color': 'rgb(255, 255, 255)'}}" is a stacked bar chart, showing Validation Studies, Phase IV, Phase III, Phase II, Phase I; with # Studies in the y-axis. The x-axis shows values from -0.5 to 21.5. The y-axis shows values from 0 to 111.57894736842105.