Edit chart
Loading graph
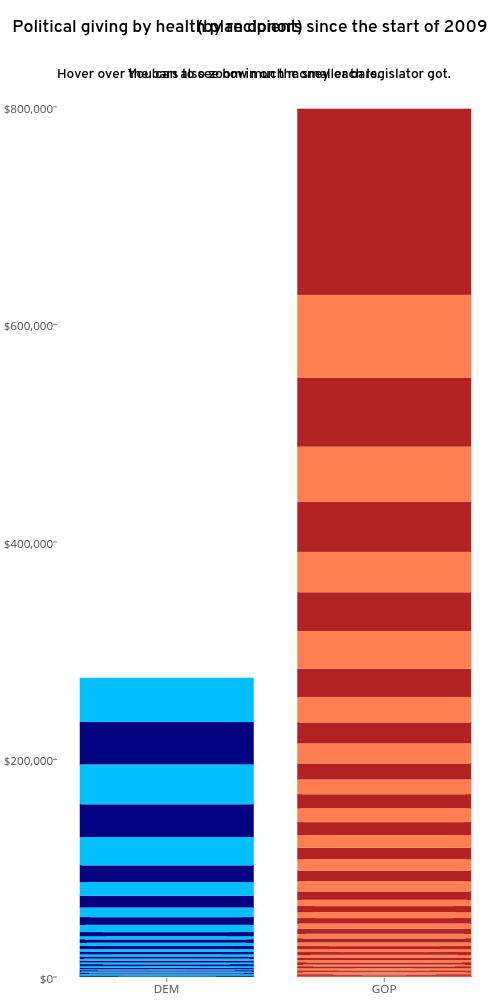
Kmlafond's interactive graph and data of "Political giving by health plan donors since the start of 2009(by recipient)" is a bar chart, showing y. The x-axis shows values from 0.5 to 2.5. The y-axis shows values from 0 to 840305.2631578947. This visualization has the following annotation: Hover over the bars to see how much money each legislator got.You can also zoom in on the smaller bars.