Edit chart
Loading graph
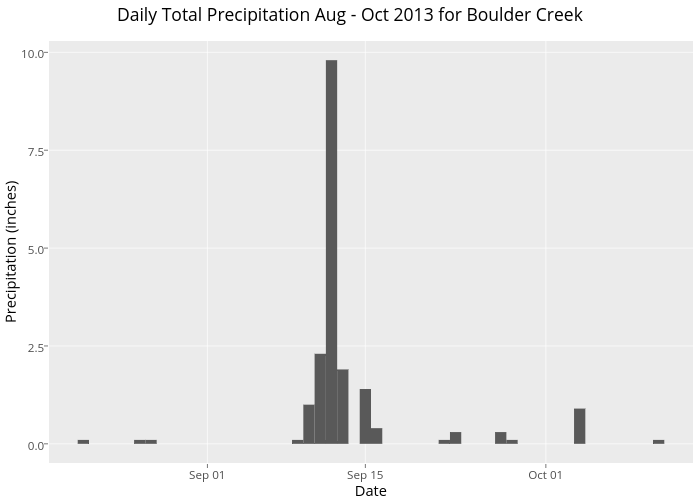
Leahawasser's interactive graph and data of "Daily Total Precipitation Aug - Oct 2013 for Boulder Creek" is a bar chart; with Date in the x-axis and Precipitation (inches) in the y-axis.. The x-axis shows values from 1376780112000 to 1381712688000. The y-axis shows values from -0.49 to 10.29.