Edit chart
Loading graph
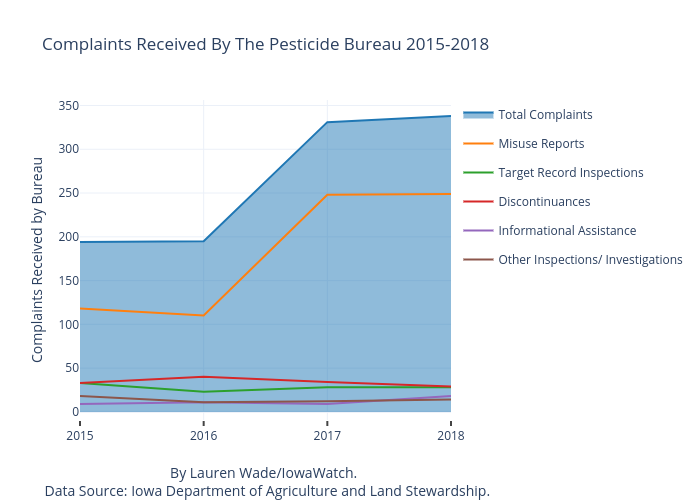
Lrmwade's interactive graph and data of "Complaints Received By The Pesticide Bureau 2015-2018" is a line chart, showing Total Complaints, Misuse Reports, Target Record Inspections, Discontinuances, Informational Assistance, Other Inspections/ Investigations; with By Lauren Wade/IowaWatch. Data Source: Iowa Department of Agriculture and Land Stewardship. in the x-axis and Complaints Received by Bureau in the y-axis.. The x-axis shows values from 2015 to 2018. The y-axis shows values from -9.277777777777775 to 356.27777777777777.