Edit chart
Loading graph
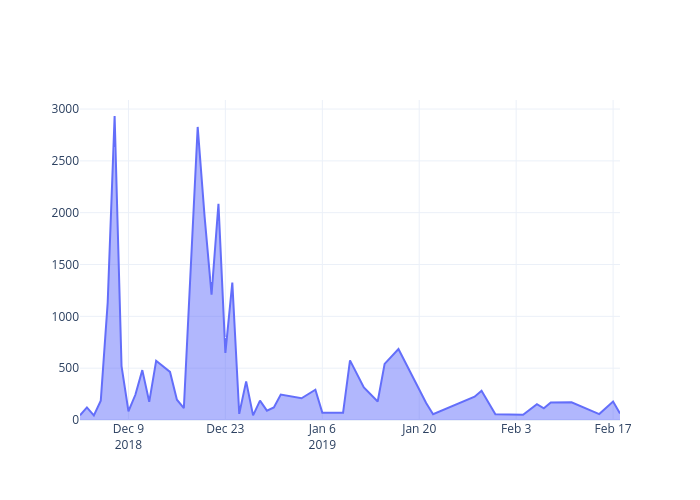
Madison_piercy's interactive graph and data is a line chart; with time in the x-axis. The x-axis shows values from 2018-12-02 to 2019-02-18. The y-axis shows values from 0 to 3087.178947368421.