Edit chart
Loading graph
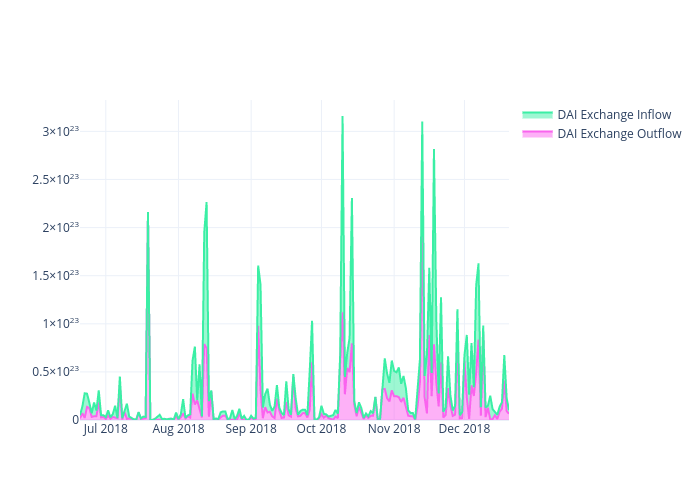
Madisonleeanne11's interactive graph and data of "DAI Exchange Outflow vs DAI Exchange Inflow" is a line chart, showing DAI Exchange Outflow vs DAI Exchange Inflow; with time in the x-axis. The x-axis shows values from 2018-06-20 to 2018-12-20. The y-axis shows values from 0 to 332631578947368470000000.