Edit chart
Loading graph
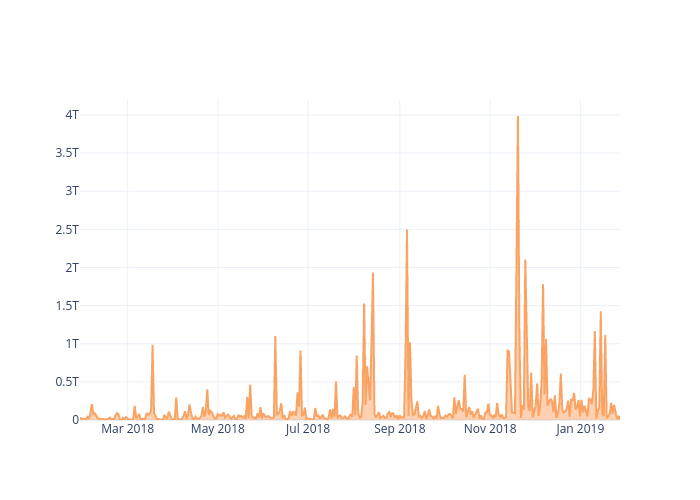
Madisonleeanne11's interactive graph and data of "DAI token movement" is a line chart, showing DAI token movement; with time in the x-axis. The x-axis shows values from 2018-01-27 19:00 to 2019-01-27 19:00. The y-axis shows values from 0 to 4195789394497.8945.