Edit chart
Loading graph
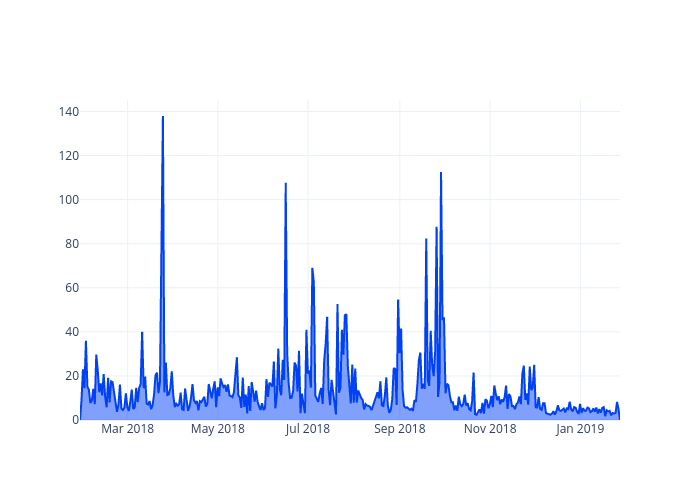
Madisonleeanne11's interactive graph and data of "token velocity" is a line chart, showing token velocity; with time in the x-axis. The x-axis shows values from 2018-01-27 19:00 to 2019-01-27 19:00. The y-axis shows values from 0 to 145.20932936842104.