Edit chart
Loading graph
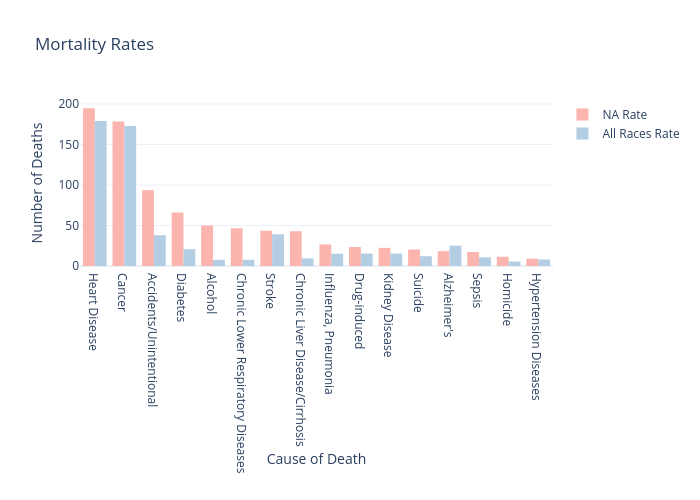
Mariakuiper's interactive graph and data of "Mortality Rates" is a bar chart, showing NA Rate vs All Races Rate ; with Cause of Death in the x-axis and Number of Deaths in the y-axis.. The x-axis shows values from -0.5 to 15.5. The y-axis shows values from 0 to 204.94736842105263.