Edit chart
Loading graph
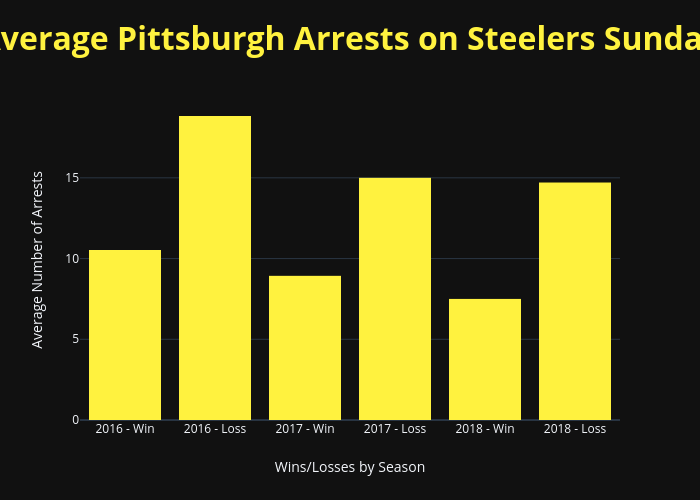
Maxkimer's interactive graph and data of "Average Pittsburgh Arrests on Steelers Sunday" is a bar chart; with Wins/Losses by Season in the x-axis and Average Number of Arrests in the y-axis.. The x-axis shows values from -0.5 to 5.5. The y-axis shows values from 0 to 19.821052631578947.