Edit chart
Loading graph
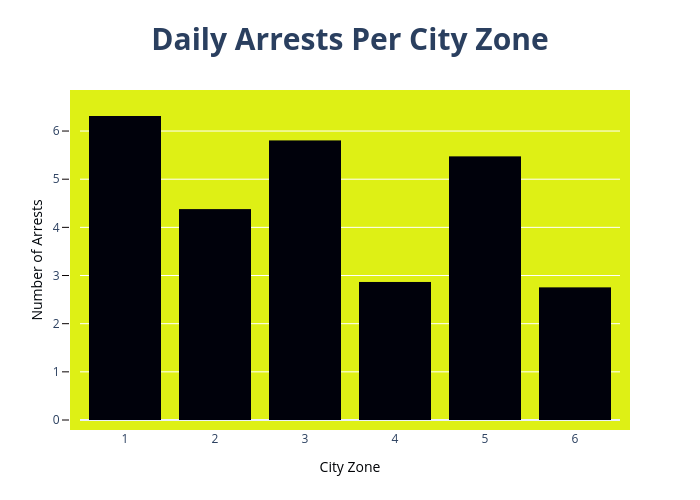
Maxkimer's interactive graph and data of "Daily Arrests Per City Zone" is a bar chart; with City Zone in the x-axis and Number of Arrests in the y-axis.. The x-axis shows values from 0.5 to 6.5. The y-axis shows values from 0 to 6.64421052631579.