Edit chart
Loading graph
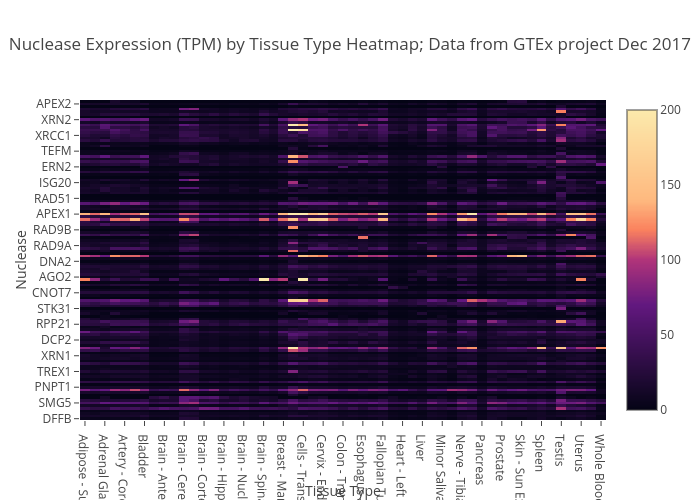
Mchiment's interactive graph and data of "Nuclease Expression (TPM) by Tissue Type Heatmap; Data from GTEx project Dec 2017" is a heatmap; with Tissue Type in the x-axis and Nuclease in the y-axis.. The x-axis shows values from -0.5 to 52.5. The y-axis shows values from -0.5 to 121.5.