Edit chart
Loading graph
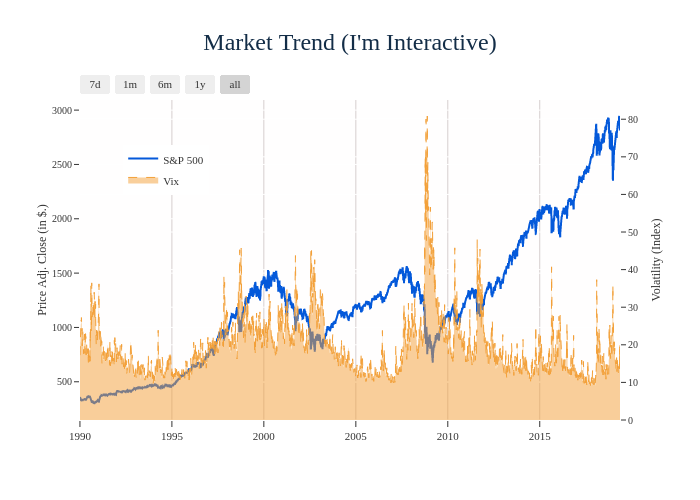
Mini_geek's interactive graph and data of "Market Trend (I'm Interactive)" is a line chart, showing S&P 500 vs Vix; with time in the x-axis and Price Adj. Close (in $.) in the y-axis.. The x-axis shows values from 1990-01-02 to 2019-05-14. The y-axis shows values from 148.21720891666666 to 3093.0728605833333.