Edit chart
Loading graph
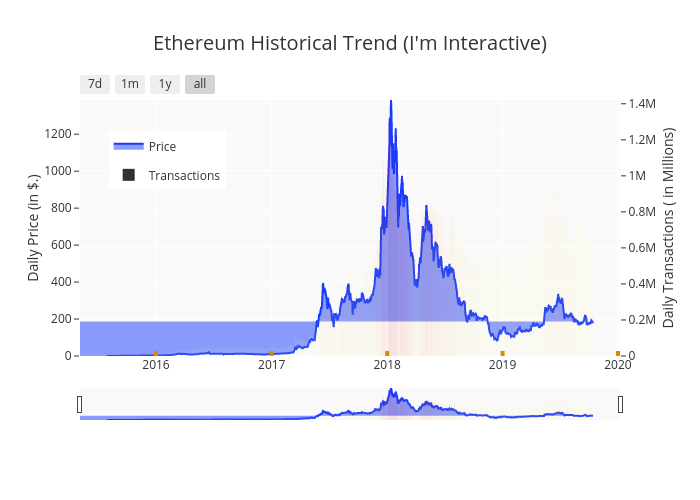
Mini_geek's interactive graph and data of "Ethereum Historical Trend (I'm Interactive)" is a filled line chart, showing Price vs Transactions; with time in the x-axis and Daily Price (in $.) in the y-axis.. The x-axis shows values from 2015-05-05 14:40 to 2020-01-07 09:20. The y-axis shows values from 0 to 1385.02.