Edit chart
Loading graph
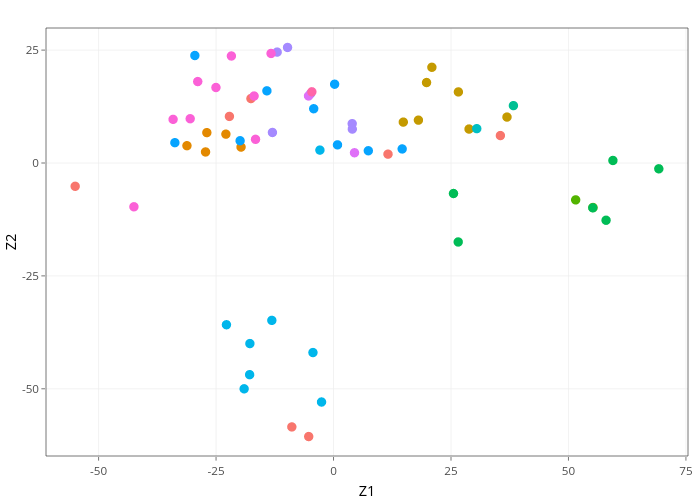
Mpalanco's interactive graph and data of "Z2 vs Z1" is a scatter chart, showing BREAST, CNS, COLON, K562A-repro, K562B-repro, LEUKEMIA, MCF7A-repro, MCF7D-repro, MELANOMA, NSCLC, OVARIAN, PROSTATE, RENAL, UNKNOWN; with Z1 in the x-axis and Z2 in the y-axis.. The x-axis shows values from -61.1945936467298 to 75.4413710108032. The y-axis shows values from -64.8848171646347 to 29.8965933811571.