Edit chart
Loading graph
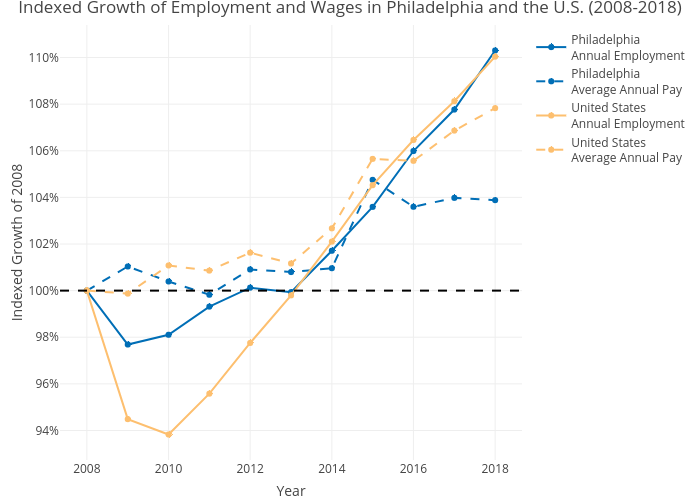
Mshields417's interactive graph and data of "Indexed Growth of Employment and Wages in Philadelphia and the U.S. (2008-2018)" is a line chart, showing PhiladelphiaAnnual Employment, PhiladelphiaAverage Annual Pay, United StatesAnnual Employment, United StatesAverage Annual Pay; with Year in the x-axis and Indexed Growth of 2008 in the y-axis.. The x-axis shows values from 0 to 0. The y-axis shows values from 0 to 0.