Edit chart
Loading graph
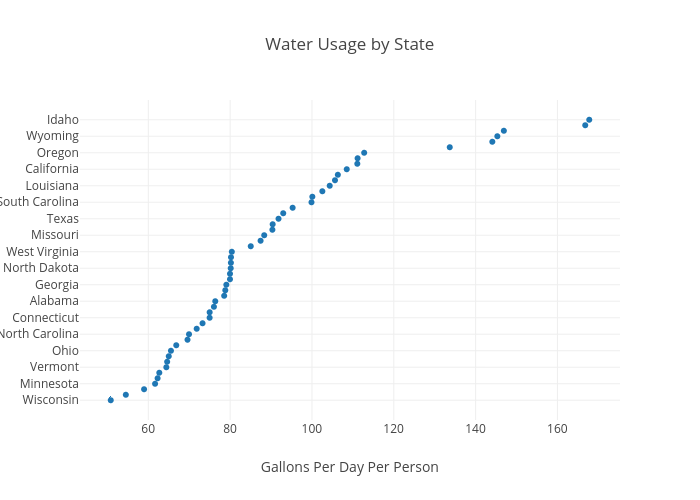
Nchandra75's interactive graph and data of "Water Usage by State" is a scatter chart, showing B; with Gallons Per Day Per Person in the x-axis and in the y-axis.. The x-axis shows values from 43.66756383859649 to 174.92453296140351. The y-axis shows values from -3.4669051878354202 to 54.46690518783542.