Edit chart
Loading graph
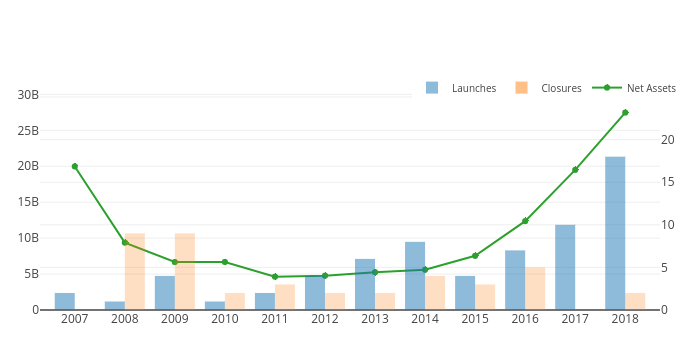
Ockhamdata's interactive graph and data of "Interval Funds: 2007-2018" is a bar chart, showing Launches, Closures, Net Assets; with Source: Interval Fund Tracker in the x-axis and Aggregate Net Assets($) in the y-axis.. The x-axis shows values from 2006.3056312443234 to 2018.6943687556766. The y-axis shows values from 0 to 32000000000.