Edit chart
Loading graph
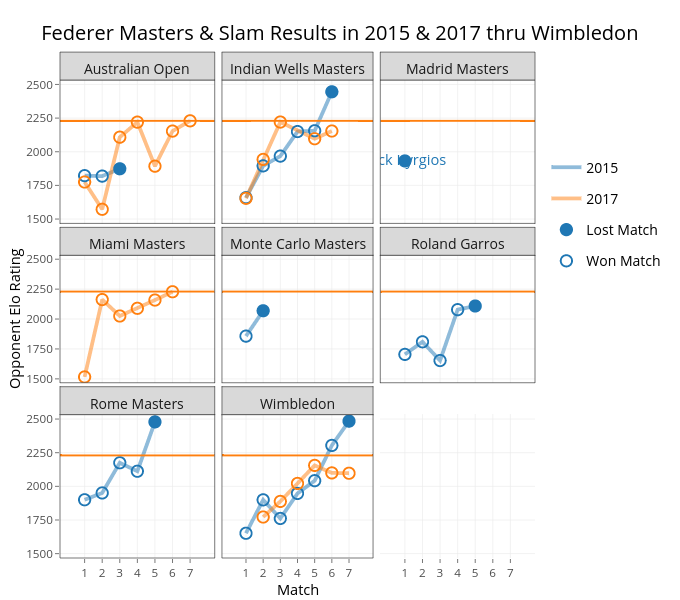
On-the-t's interactive graph and data of "Federer Masters & Slam Results in 2015 & 2017 thru Wimbledon" is a line chart, showing (2015,1), (2015,2), (2015,3), (2015,5), (2015,6), (2015,7), 2015, (2017,1), (2017,2), (2017,4), 2017, (2015,1), (2015,2), (2015,3), (2015,5), (2015,6), (2015,7), (2015,8), (2017,1), (2017,2), (2017,4), (2017,8), Lost Match, (FALSE,2015), (FALSE,2015), (FALSE,2015), (FALSE,2015), (FALSE,2015), (FALSE,2015), Won Match, (TRUE,2015), (TRUE,2015), (TRUE,2015), (TRUE,2015), (TRUE,2015), (TRUE,2017), (TRUE,2017), (TRUE,2017), (TRUE,2017), [], [], [], [], [], [], [], []. The x-axis shows values from -0.4 to 8.4. The y-axis shows values from 1467.62362786863 to 2532.96080843911. This visualization has the following annotations: Match; Opponent Elo Rating; Australian Open; Indian Wells Masters; Madrid Masters; Miami Masters; Monte Carlo Masters; Roland Garros; Rome Masters; Wimbledon