Edit chart
Loading graph
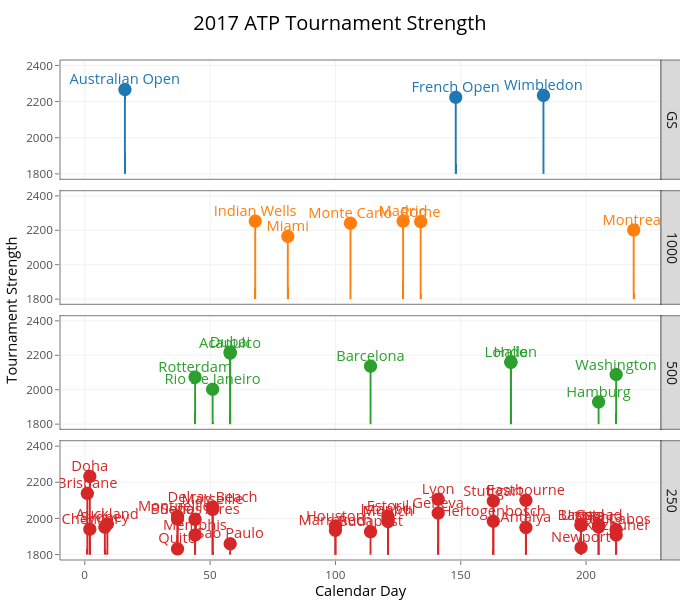
On-the-t's interactive graph and data of "2017 ATP Tournament Strength" is a scatter chart, showing GS, 1000, 500, 250, GS, 1000, 500, 250, GS, 1000, 500, 250. The x-axis shows values from -9.9 to 229.9. The y-axis shows values from 1770 to 2430. This visualization has the following annotations: Calendar Day; Tournament Strength; GS; 1000; 500; 250