Edit chart
Loading graph
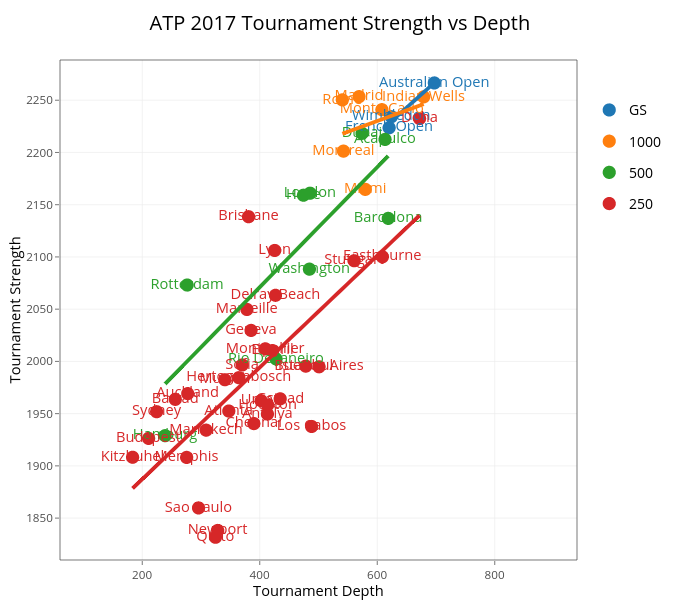
On-the-t's interactive graph and data of "ATP 2017 Tournament Strength vs Depth" is a scatter chart, showing GS, 1000, 500, 250, GS, 1000, 500, 250, GS, 1000, 500, 250, GS, 1000, 500, 250; with Tournament Depth in the x-axis and Tournament Strength in the y-axis.. The x-axis shows values from 60 to 940. The y-axis shows values from 1809.88943332995 to 2288.51041572006.