Edit chart
Loading graph
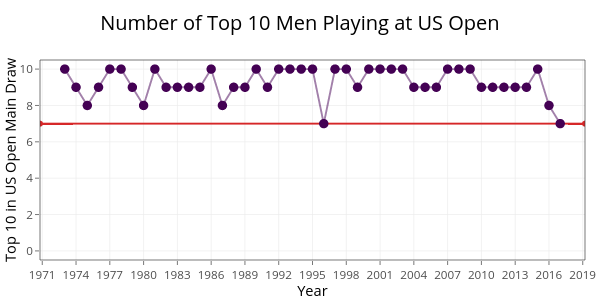
On-the-t's interactive graph and data of "Number of Top 10 Men Playing at US Open" is a ; with Year in the x-axis and Top 10 in US Open Main Draw in the y-axis.. The x-axis shows values from 1970.8 to 2019.2. The y-axis shows values from -0.5 to 10.5.