Edit chart
Loading graph
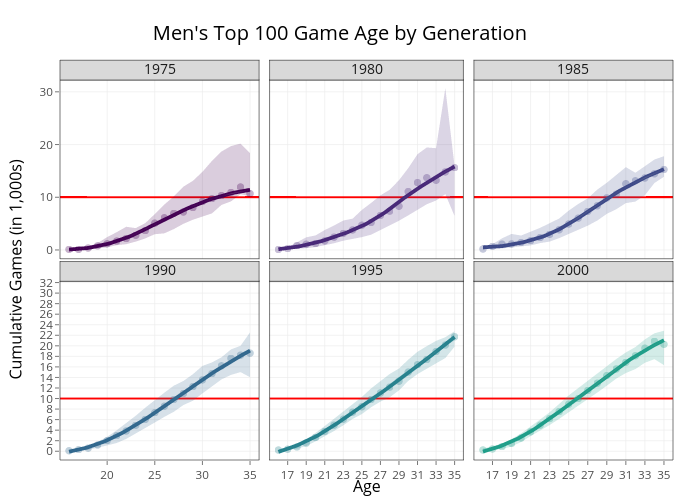
On-the-t's interactive graph and data of "Men's Top 100 Game Age by Generation" is a line chart, showing (1975,1), (1980,2), (1985,3), (1990,4), (1995,5), (2000,6), (1975,1), (1980,2), (1985,3), (1990,4), (1995,5), (2000,6), (1975,1), (1980,2), (1985,3), (1990,4), (1995,5), (2000,6), (1975,1), (1980,2), (1985,3), (1990,4), (1995,5), (2000,6). The x-axis shows values from 15.05 to 35.95. The y-axis shows values from -1.66175333209276 to 32.243131111052. This visualization has the following annotations: Age; Cumulative Games (in 1,000s); 1975; 1980; 1985; 1990; 1995; 2000