Edit chart
Loading graph
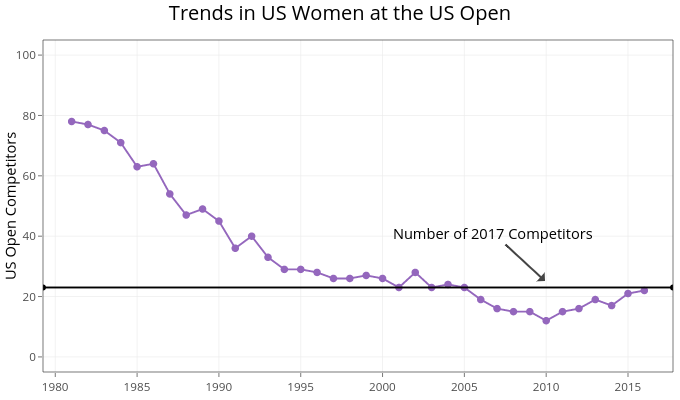
On-the-t's interactive graph and data of "Trends in US Women at the US Open" is a ; with in the x-axis and US Open Competitors in the y-axis.. The x-axis shows values from 1979.25 to 2017.75. The y-axis shows values from -5 to 105. This visualization has the following annotation: Number of 2017 Competitors