Edit chart
Loading graph
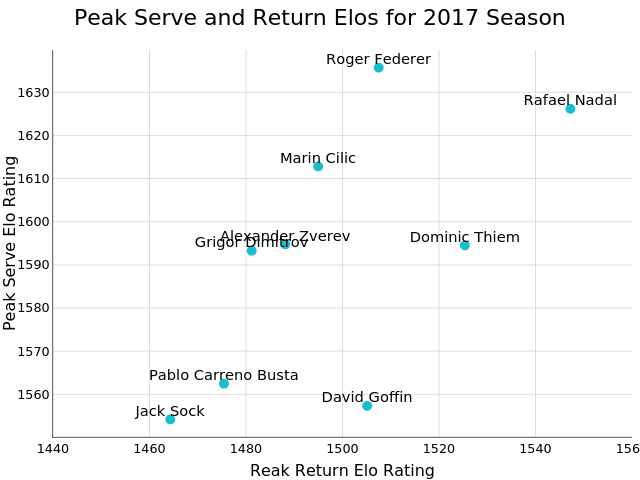
On-the-t's interactive graph and data of "Peak Serve and Return Elos for 2017 Season" is a scatter chart; with Reak Return Elo Rating in the x-axis and Peak Serve Elo Rating in the y-axis.. The x-axis shows values from 1440 to 1560. The y-axis shows values from 1550.11472518468 to 1639.77865387242.