Edit chart
Loading graph
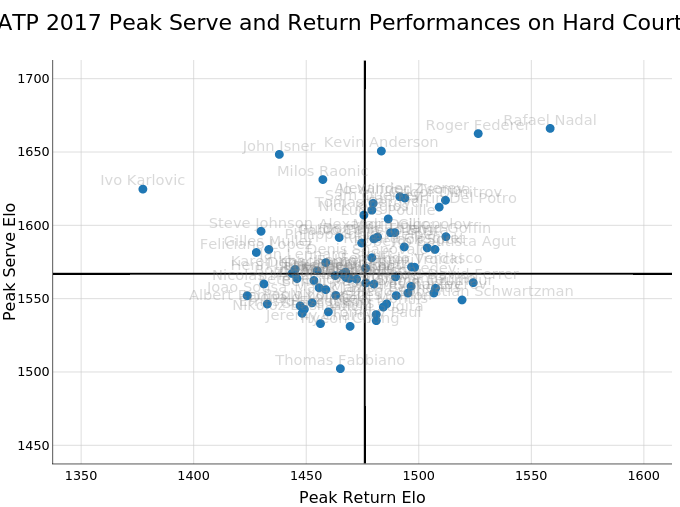
On-the-t's interactive graph and data of "ATP 2017 Peak Serve and Return Performances on Hard Court" is a scatter chart; with Peak Return Elo in the x-axis and Peak Serve Elo in the y-axis.. The x-axis shows values from 1337.5 to 1612.5. The y-axis shows values from 1437.5 to 1712.5.