Edit chart
Loading graph
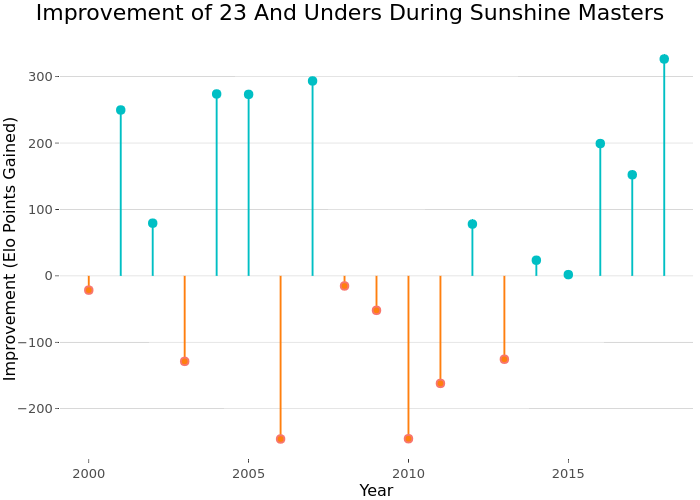
On-the-t's interactive graph and data of "Improvement of 23 And Unders During Sunshine Masters" is a line chart, showing 0, 1, 0, 1; with Year in the x-axis and Improvement (Elo Points Gained) in the y-axis.. The x-axis shows values from 1999.1 to 2018.9. The y-axis shows values from -274.297857275878 to 355.188629906044. This visualization has the following annotation: Type