Edit chart
Loading graph
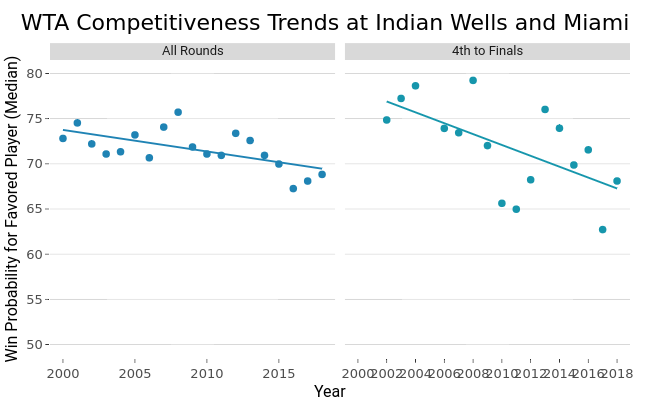
On-the-t's interactive graph and data of "WTA Competitiveness Trends at Indian Wells and Miami" is a line chart, showing All Rounds, 4th to Finals, All Rounds, 4th to Finals, All Rounds, 4th to Finals. The x-axis shows values from 1999.1 to 2018.9. The y-axis shows values from 48.5 to 81.5. This visualization has the following annotations: Year; Win Probability for Favored Player (Median); All Rounds; 4th to Finals