Edit chart
Loading graph
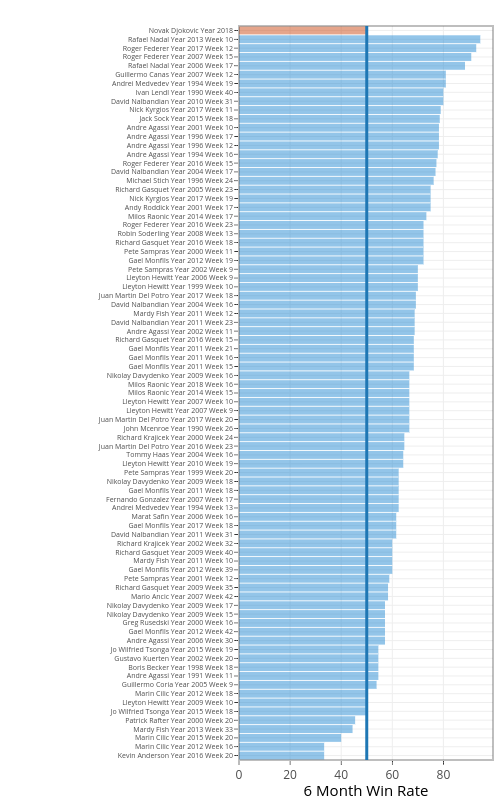
On-the-t's interactive graph and data of "data.1.y vs data.2.y" is a , showing data.1.y vs data.2.y; with 6 Month Win Rate in the x-axis. The x-axis shows values from 0 to 99.41520467836253. The y-axis shows values from -0.5 to 82.5.