Edit chart
Loading graph
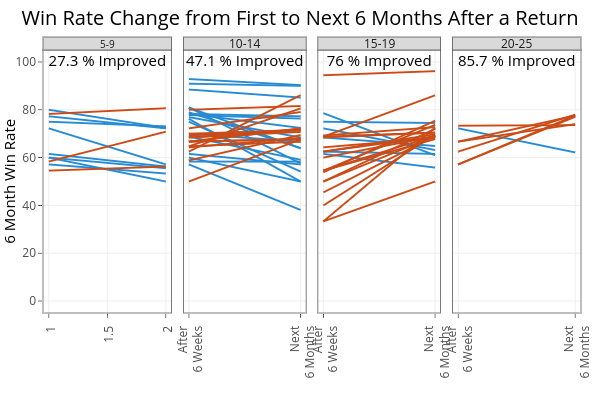
On-the-t's interactive graph and data of "Win Rate Change from First to Next 6 Months After a Return" is a line chart, showing FALSE, FALSE, FALSE, FALSE, TRUE, TRUE, TRUE, TRUE. The x-axis shows values from 0.95 to 2.05. The y-axis shows values from -5 to 105. This visualization has the following annotations: 6 Month Win Rate; 5-9; 10-14; 15-19; 20-25