Edit chart
Loading graph
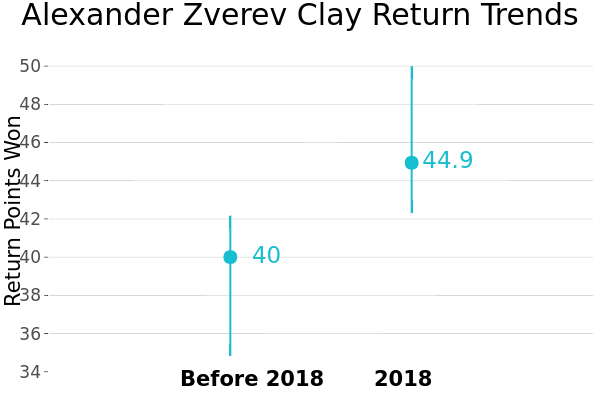
On-the-t's interactive graph and data of "Alexander Zverev Clay Return Trends" is a line chart, showing data.1.y; with Return Points Won in the y-axis. The x-axis shows values from 0 to 3. The y-axis shows values from 33.98876404494383 to 50.842696629213435. This visualization has the following annotations: Before 2018; 2018