Edit chart
Loading graph
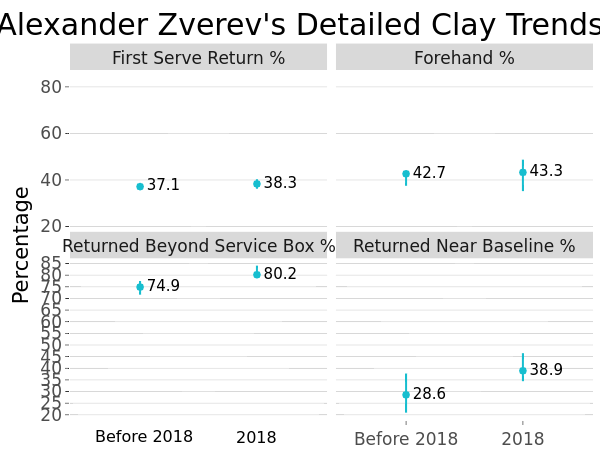
On-the-t's interactive graph and data of "Alexander Zverev's Detailed Clay Trends" is a line chart. The x-axis shows values from 0.4 to 2.6. The y-axis shows values from 17.7721987315011 to 87.2489429175476. This visualization has the following annotations: Percentage; First Serve Return %; Forehand %; Returned Beyond Service Box %; Returned Near Baseline %; Before 2018; 2018