Edit chart
Loading graph
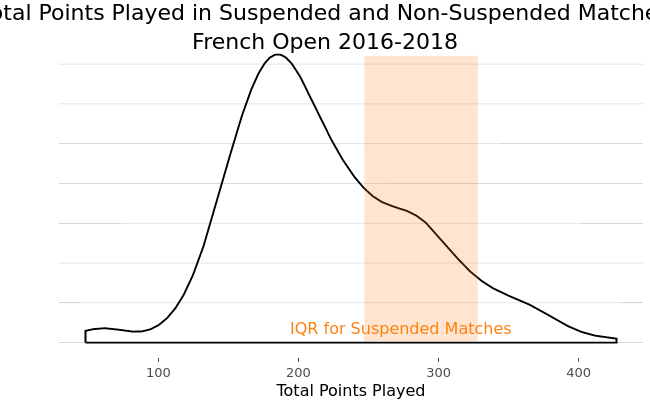
On-the-t's interactive graph and data of "Total Points Played in Suspended and Non-Suspended MatchesFrench Open 2016-2018" is a filled line chart; with Total Points Played in the x-axis and in the y-axis.. The x-axis shows values from 29.05 to 445.95. The y-axis shows values from -0.000362189853572443 to 0.00760598692502131. This visualization has the following annotation: IQR for Suspended Matches