Edit chart
Loading graph
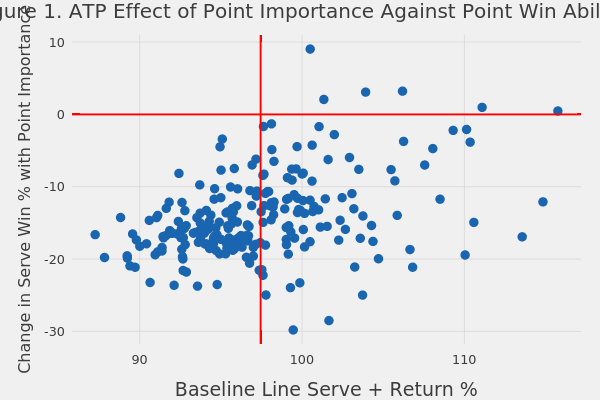
On-the-t's interactive graph and data of "Figure 1. ATP Effect of Point Importance Against Point Win Ability" is a scatter chart, showing , , ; with Baseline Line Serve + Return % in the x-axis and Change in Serve Win % with Point Importance in the y-axis.. The x-axis shows values from 85.8347721167266 to 117.180568133462. The y-axis shows values from -31.7418833834318 to 10.9815521813977.