Edit chart
Loading graph
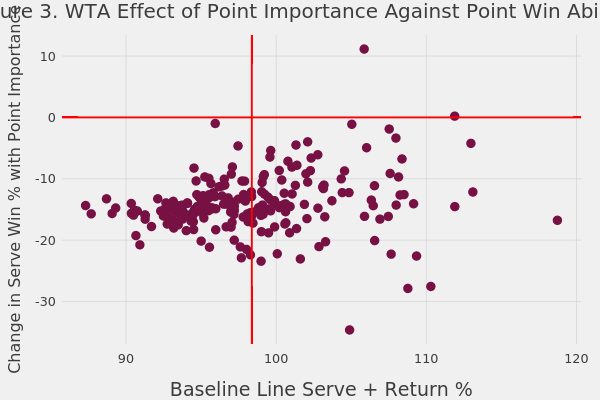
On-the-t's interactive graph and data of "Figure 3. WTA Effect of Point Importance Against Point Win Ability" is a scatter chart, showing , , ; with Baseline Line Serve + Return % in the x-axis and Change in Serve Win % with Point Importance in the y-axis.. The x-axis shows values from 85.732039539533 to 120.302972838318. The y-axis shows values from -36.929642503464 to 13.43.