Edit chart
Loading graph
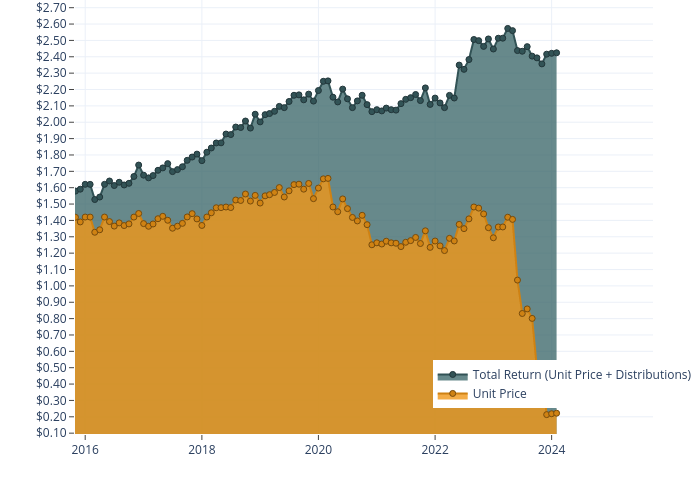
Pidotcom's interactive graph and data of " vs " is a filled , showing Total Return (Unit Price + Distributions) vs Unit Price; with in the x-axis and in the y-axis.. The x-axis shows values from 2015-10-29 01:40:43.3213 to 2025-09-27 01:40:43.3213. The y-axis shows values from 0.09488019028767708 to 2.7469956603098824.