Edit chart
Loading graph
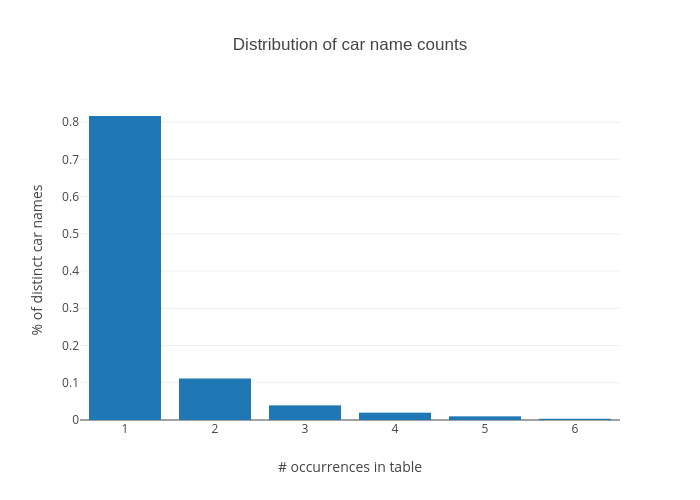
Ryantlee9's interactive graph and data of "Distribution of car name counts" is a bar chart; with # occurrences in table in the x-axis and % of distinct car names in the y-axis.. The x-axis shows values from 0.5 to 6.5. The y-axis shows values from 0 to 0.8593615185504745.