Edit chart
Loading graph
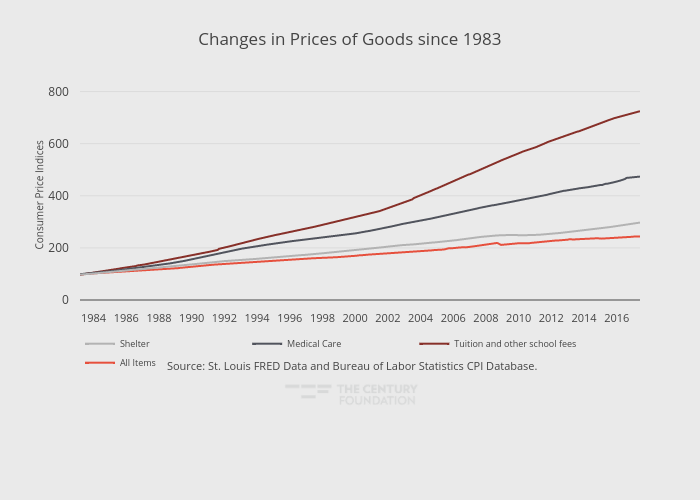
Thecenturyfoundation's interactive graph and data of "Changes in Prices of Goods since 1983" is a line chart, showing All Items, Tuition and other school fees, Medical Care, Shelter; with in the x-axis and Consumer Price Indices in the y-axis.. The x-axis shows values from 1983-03-01 to 2017-06-01. The y-axis shows values from 0 to 806. This visualization has the following annotation: Source: St. Louis FRED Data and Bureau of Labor Statistics CPI Database.