Edit chart
Loading graph
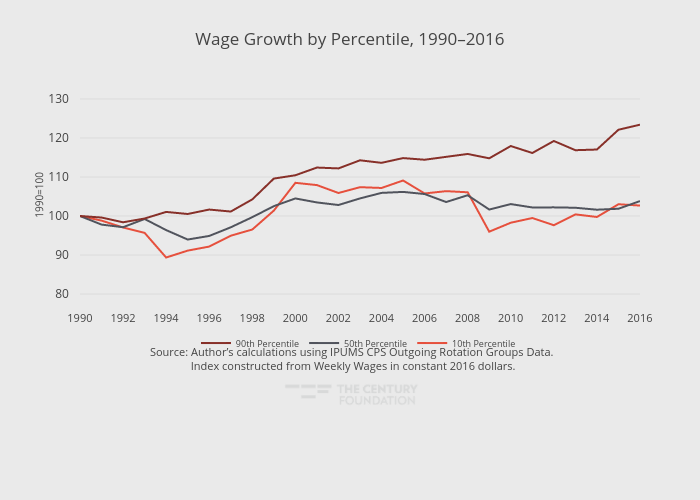
Thecenturyfoundation's interactive graph and data of "Wage Growth by Percentile, 1990–2016" is a line chart, showing 10th Percentile, 50th Percentile, 90th Percentile; with in the x-axis and 1990=100 in the y-axis.. The x-axis shows values from 1990 to 2016. The y-axis shows values from 78.47029933166667 to 132.29835529833332. This visualization has the following annotation: Source: Author’s calculations using IPUMS CPS Outgoing Rotation Groups Data.<br> Index constructed from Weekly Wages in constant 2016 dollars.