Edit chart
Loading graph
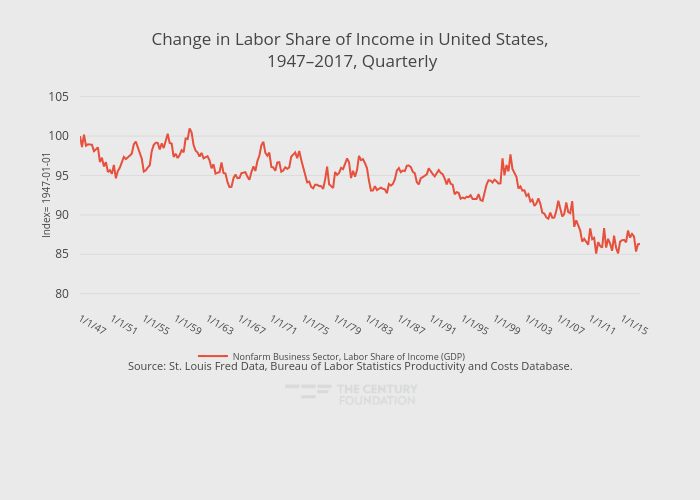
Thecenturyfoundation's interactive graph and data of "Change in Labor Share of Income in United States, 1947–2017, Quarterly" is a line chart, showing Nonfarm Business Sector, Labor Share of Income (GDP); with in the x-axis and Index= 1947-01-01 in the y-axis.. The x-axis shows values from 0 to 281. The y-axis shows values from 79.19811777777778 to 105.84936222222223. This visualization has the following annotation: Source: St. Louis Fred Data, Bureau of Labor Statistics Productivity and Costs Database.