Edit chart
Loading graph
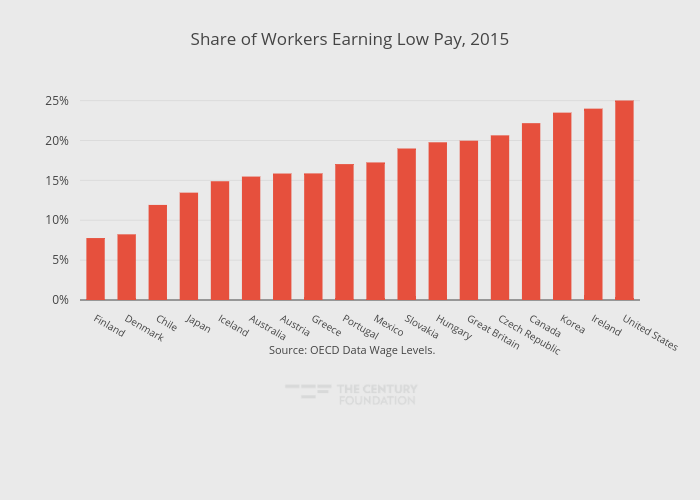
Thecenturyfoundation's interactive graph and data of "Share of Workers Earning Low Pay, 2015" is a bar chart, showing B; with in the x-axis. The x-axis shows values from -0.5 to 17.5. The y-axis shows values from 0 to 26.337743263157893. This visualization has the following annotation: Source: OECD Data Wage Levels.