Edit chart
Loading graph
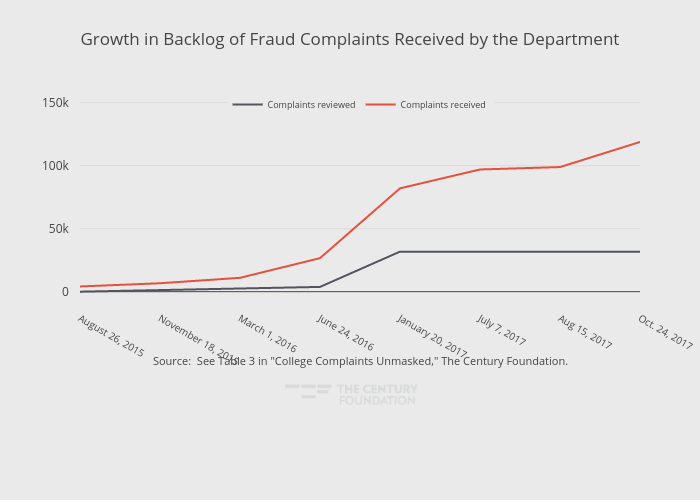
Thecenturyfoundation's interactive graph and data of "Growth in Backlog of Fraud Complaints Received by the Department" is a line chart, showing Complaints received vs Complaints reviewed; with in the x-axis. The x-axis shows values from 0 to 7. The y-axis shows values from -6598.499999999999 to 160000. This visualization has the following annotation: Source: See Table 3 in "College Complaints Unmasked," The Century Foundation.