Edit chart
Loading graph
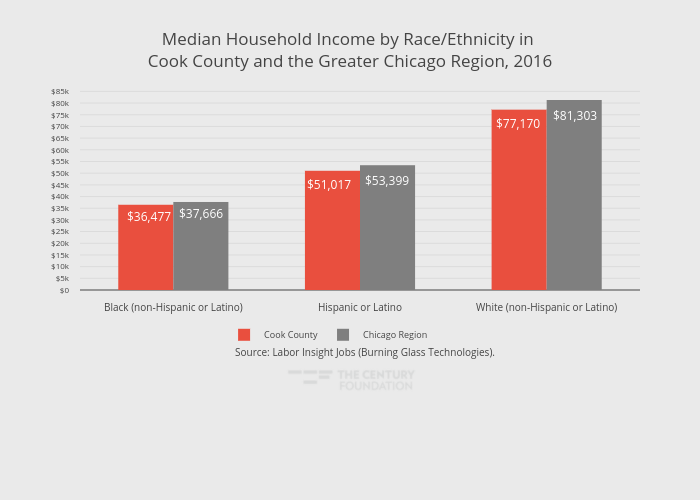
Thecenturyfoundation's interactive graph and data of "Median Household Income by Race/Ethnicity in Cook County and the Greater Chicago Region, 2016" is a grouped bar chart, showing Cook County vs Chicago Region; with in the y-axis. The x-axis shows values from -0.5 to 2.5. The y-axis shows values from 0 to 85582.1052631579. This visualization has the following annotations: Source: Labor Insight Jobs (Burning Glass Technologies).; $36,477; $37,666; $51,017; $53,399; $77,170; $81,303